Changelog: Feature engagement
Understanding who’s using your features and how that changes over time helps your team learn from real behavior. This release adds a Top customers view to a story’s feature engagement, showing usage by customer alongside the existing environment view.
Top customers
Feature engagement now defaults to showing usage by customer, helping you identify your most engaged users and understand adoption patterns across your customer base. It highlights the top 10 customers for each feature, showing who’s interacting most and who’s best positioned to provide meaningful feedback.
You can select a graph type to visualize your data:
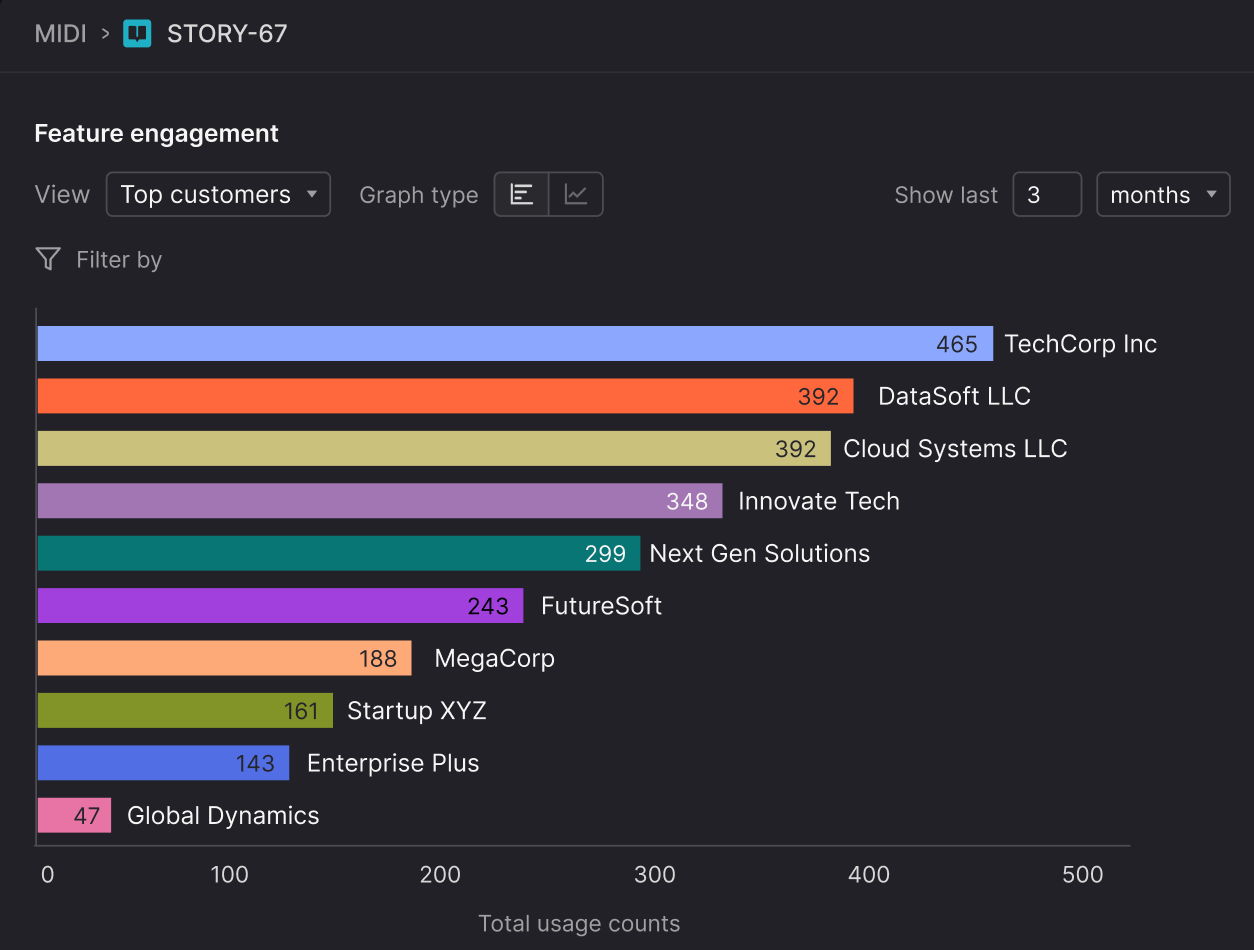
- Bar chart: shows total usage counts for the selected period. It’s a quick way to see which customers use a feature most.
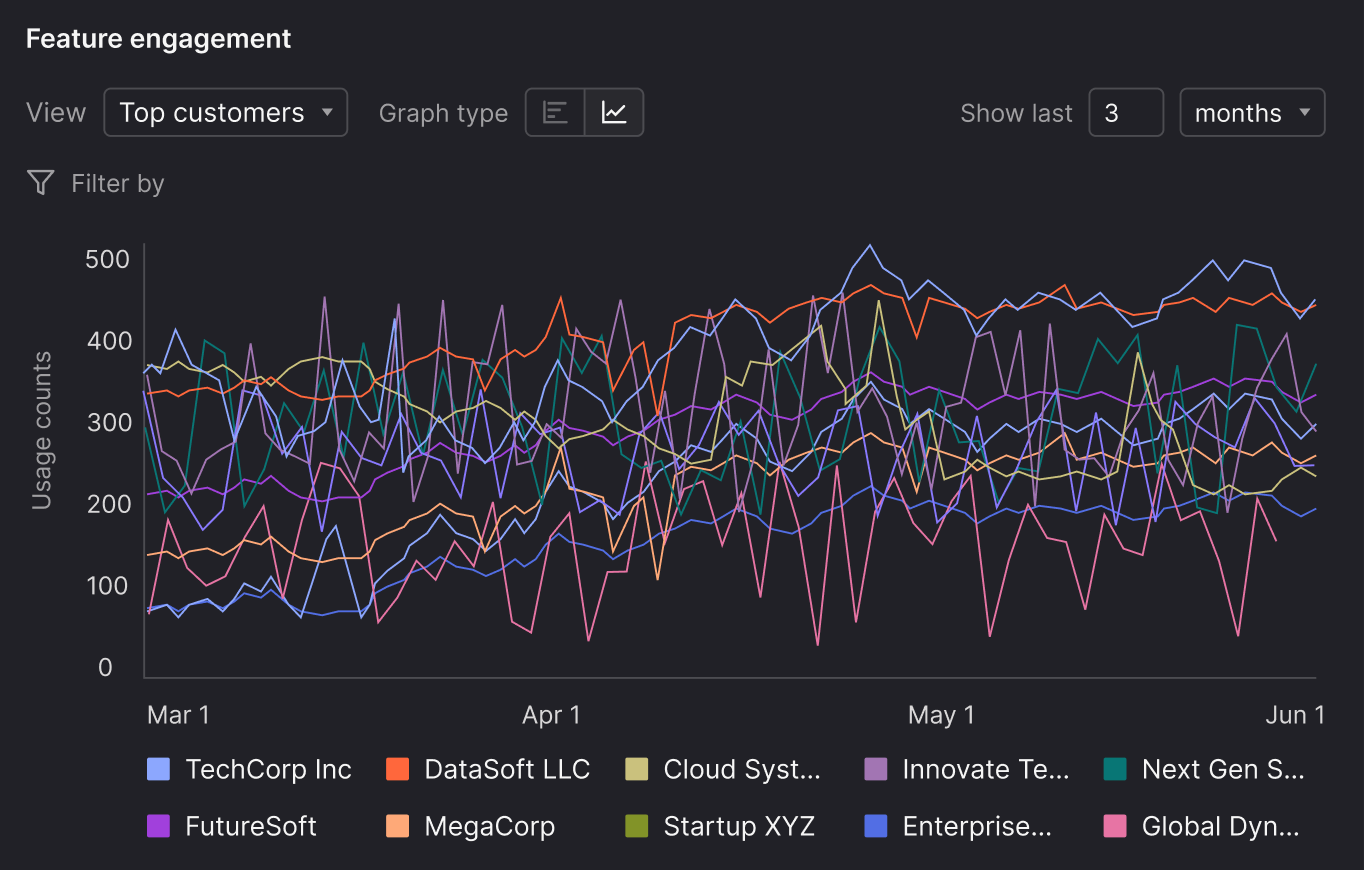
- Line graph: tracks engagement trends over time for each customer. Toggle individual customer lines on or off to focus on specific segments, and filter by location or environment to see how adoption varies across different contexts.
These views work together to reveal both overall usage and engagement trends, helping product and customer teams connect real adoption with customer insight.