Level up your planning
We’re continuing to invest in Atono’s planning tools, making it easier to track progress, coordinate timelines with release dates, and refine the data behind your estimates. These updates are part of a series of enhancements you’ll see throughout the year to help your team plan with clarity and confidence.
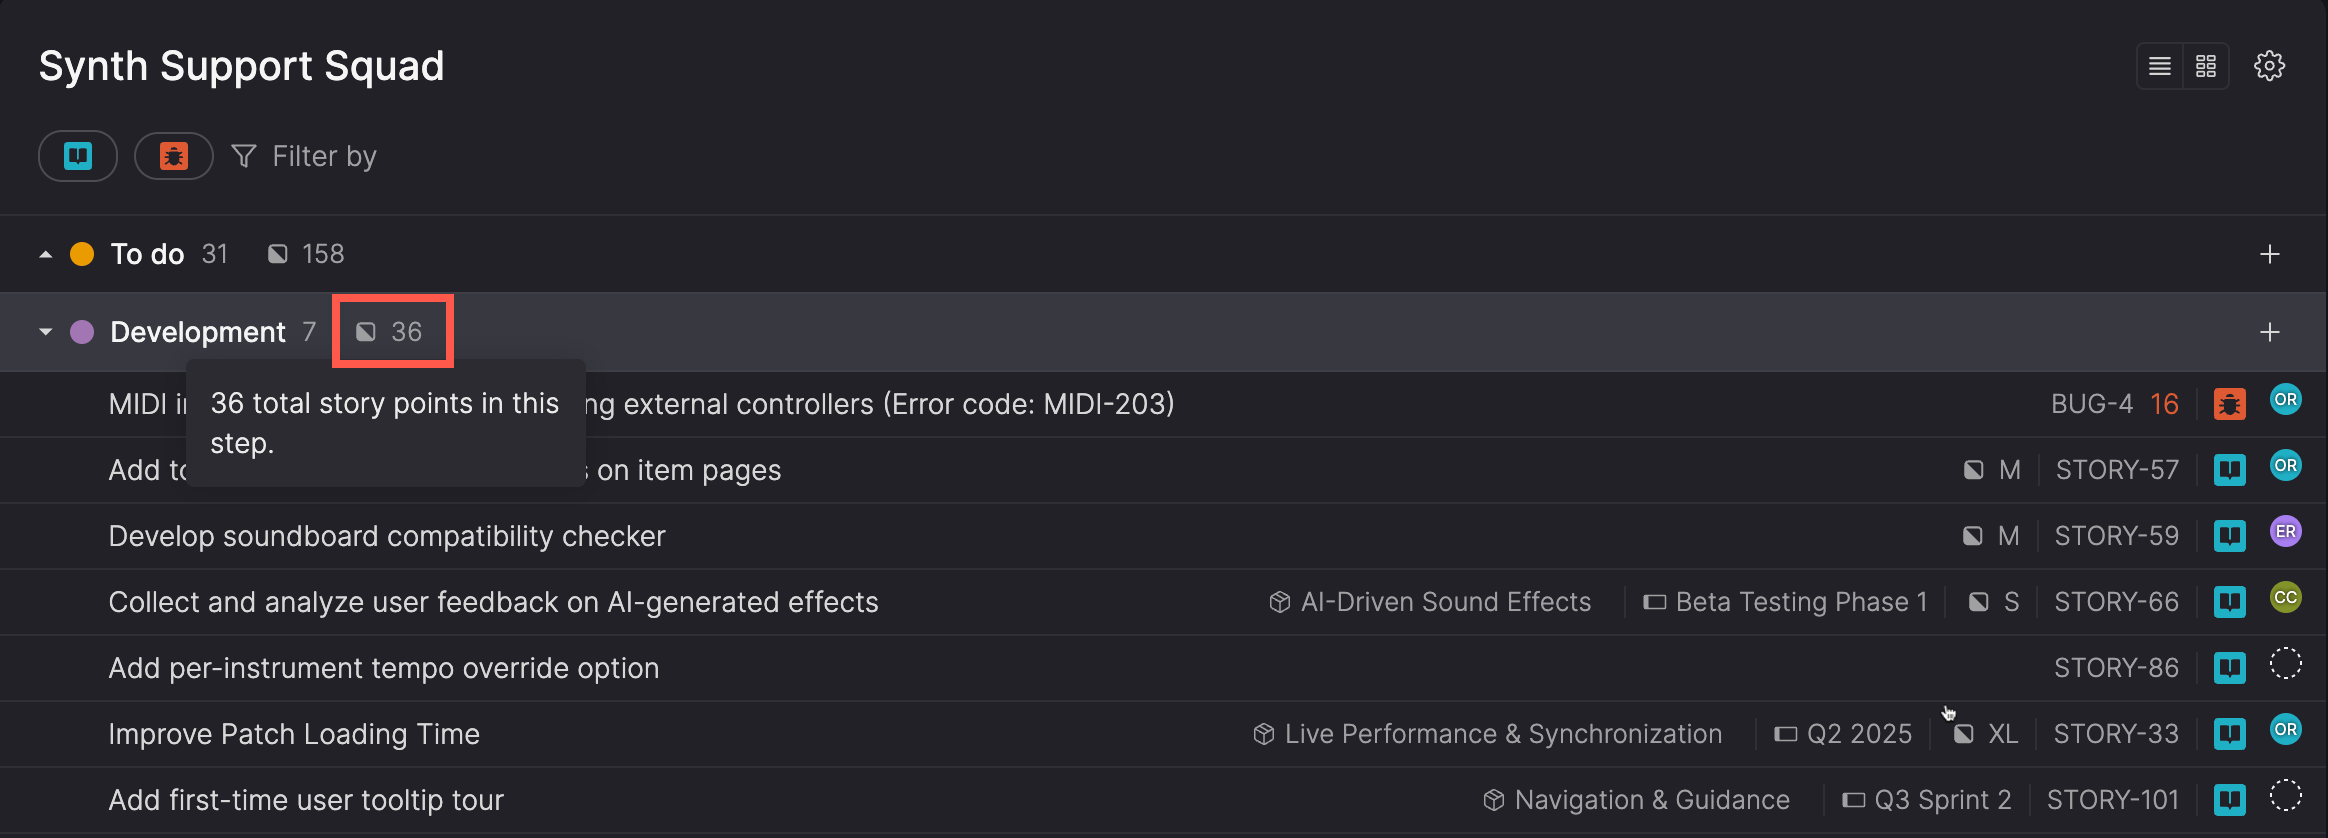
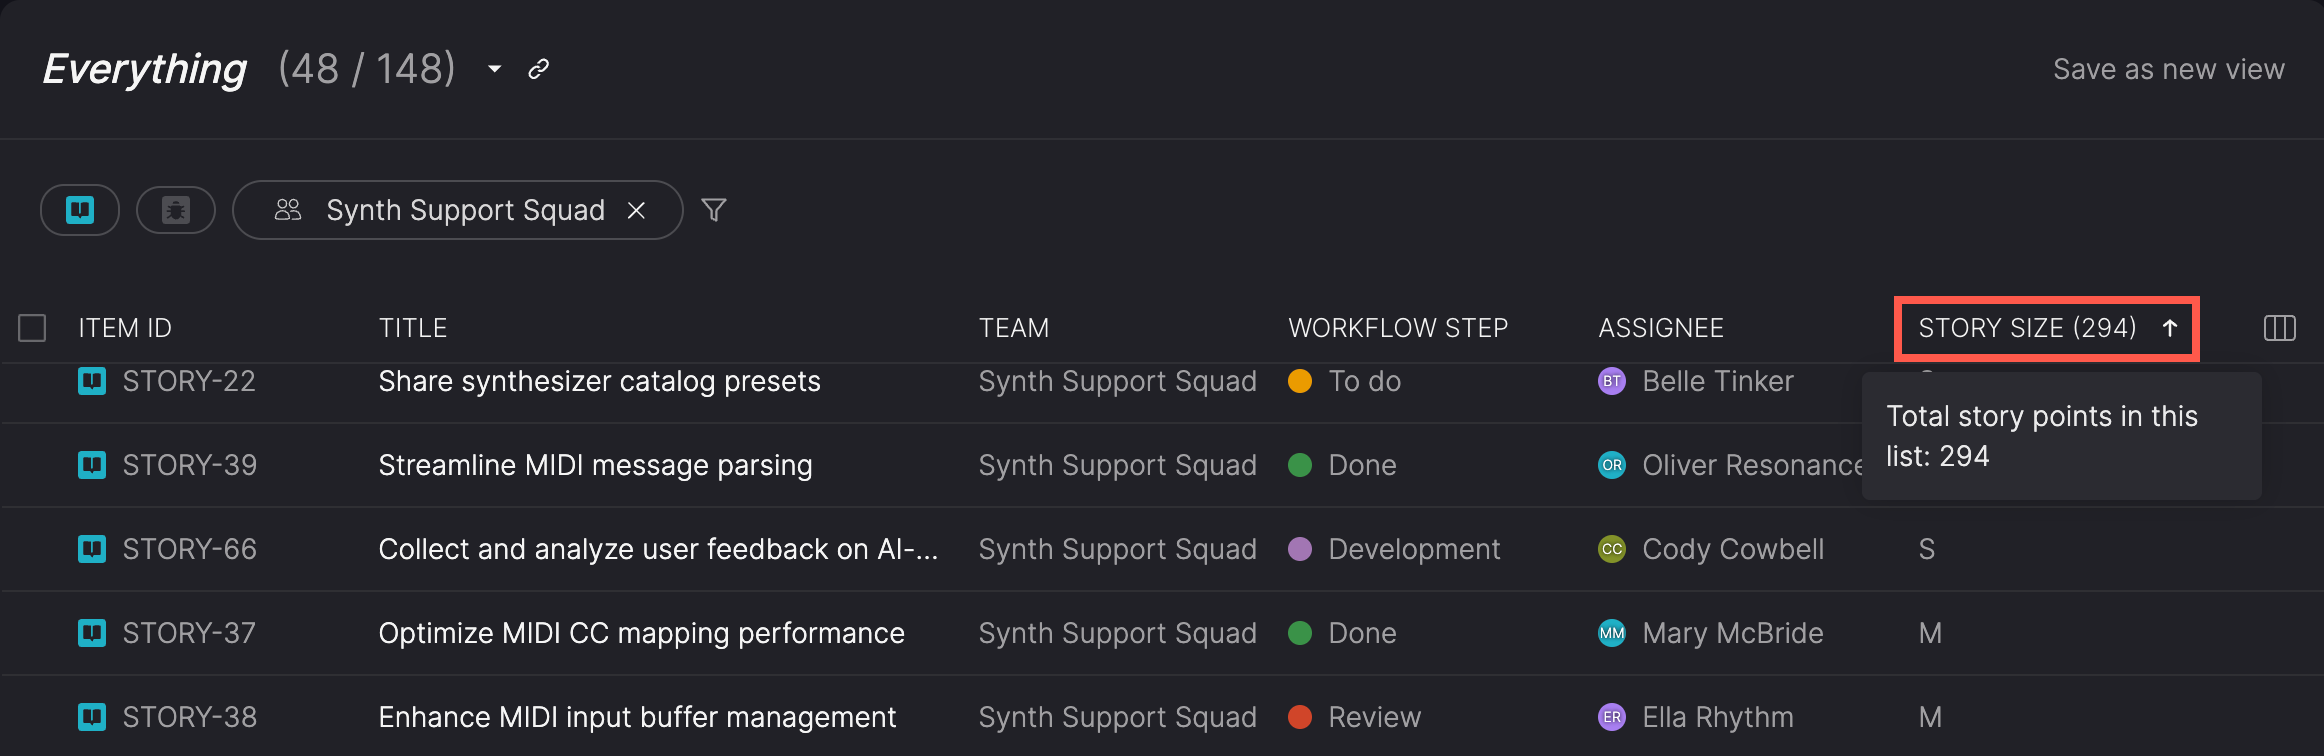
Total story points
Total story points show the combined size of all visible stories in a list, helping you gauge work in progress, spot overloaded workflow steps, and compare upcoming plans to your team’s usual capacity.
You’ll see these totals in the team backlog step headers and at the top of the Story size column on the Everything page.
What about unsized stories?
If a story doesn’t have a size, Atono estimates one based on the average size of completed stories from the team’s current cycle time window. This keeps totals consistent and easy to interpret—even when some work hasn’t been sized yet.
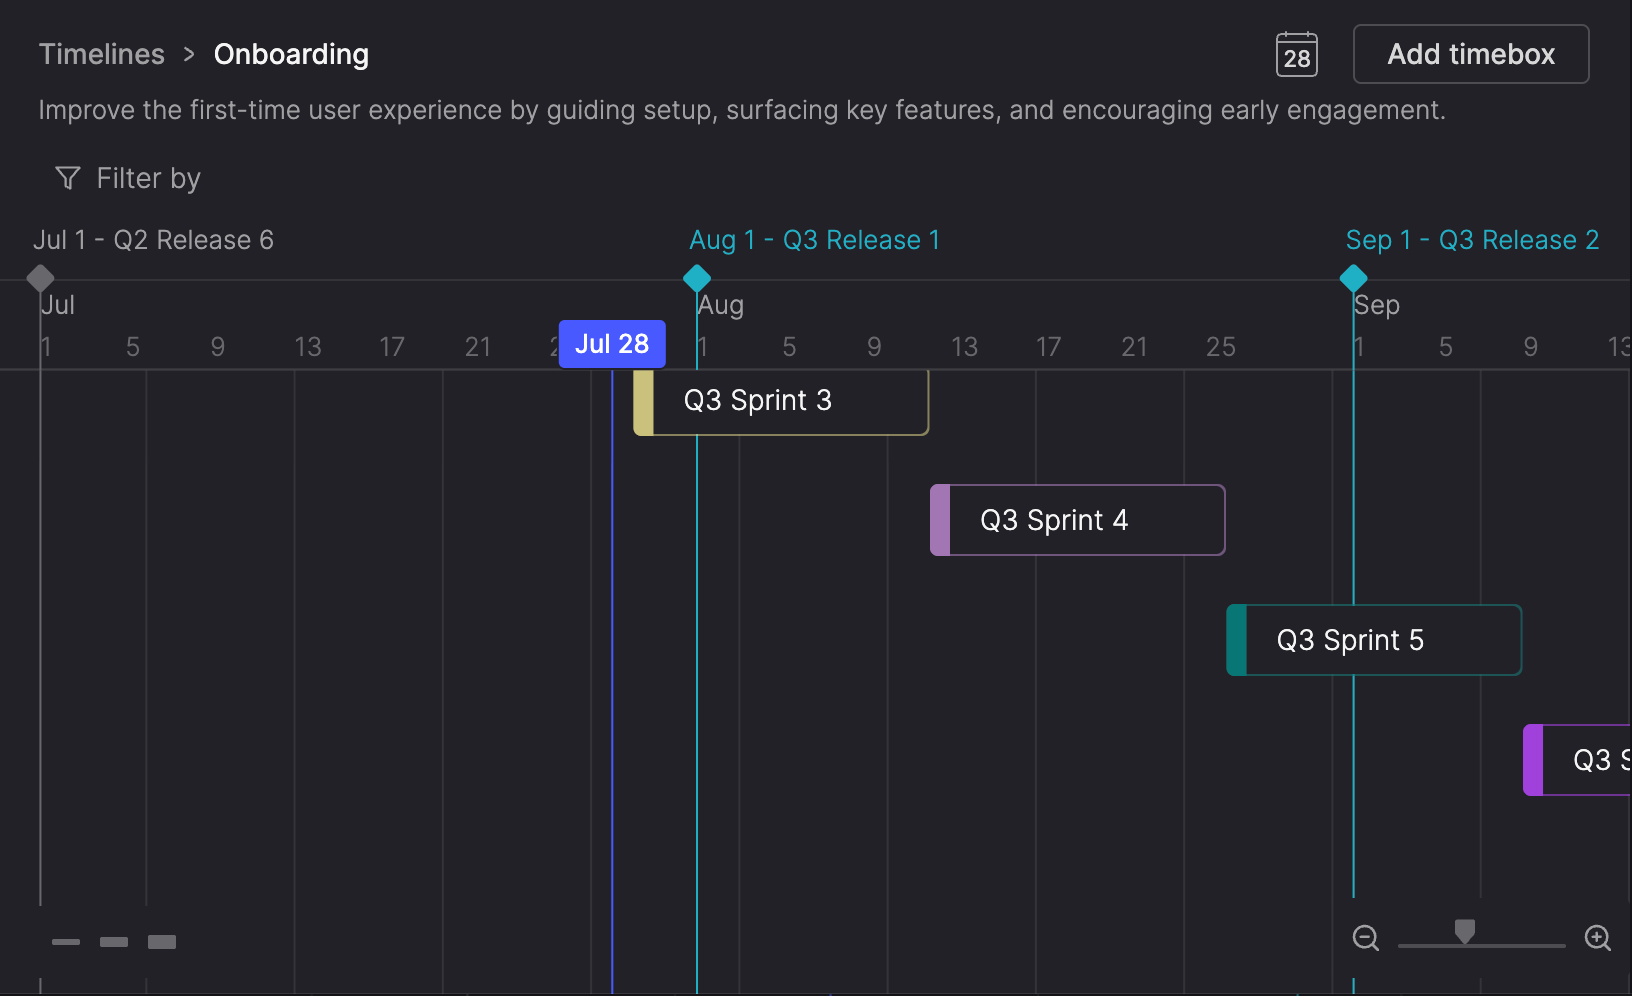
Mark releases on your timeline
Add release markers to show key launch dates right on your timeline. Each marker appears as a vertical line, making it easy to see and coordinate work against upcoming releases. You can add, rename, move, or delete markers directly on the timeline. They snap to gridlines and timebox boundaries based on your zoom level—keeping release dates anchored to your schedule.
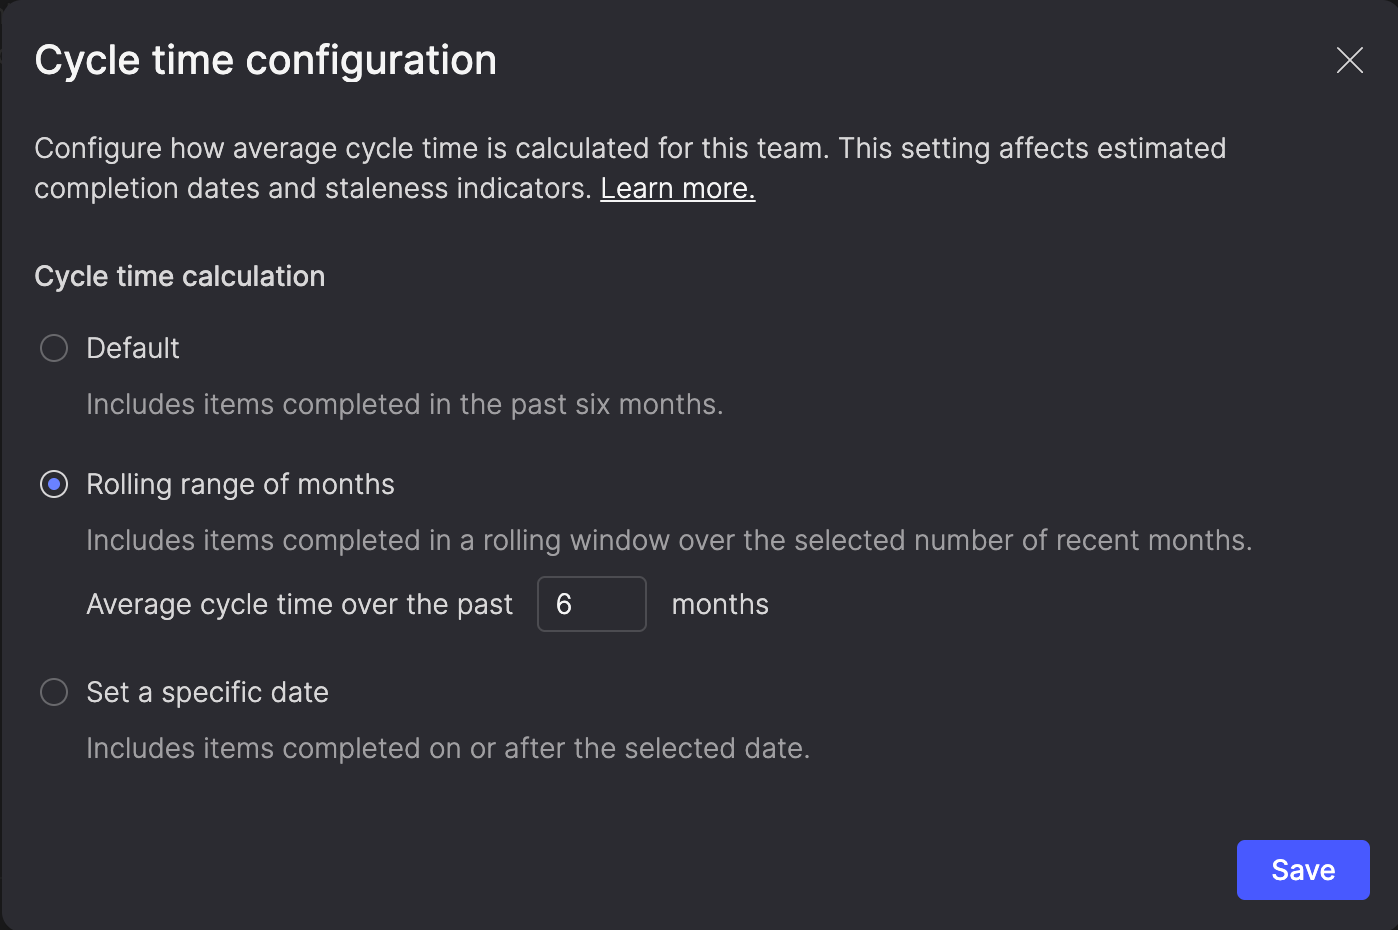
Customize your team’s cycle time window
Cycle time tracks how long it takes your team to finish work. It’s average helps Atono estimate completion dates, highlight outliers, and spot changes in your team’s velocity.
You can now choose the window used to calculate that average:
- Stick with the default 6-month view
- Select a rolling window from 1 to 12 recent months
- Set a specific start date
This flexibility lets you adjust metrics when your workflow or resourcing changes—so your data reflects how your team works today.