Track feature engagement
August 15th, 2025
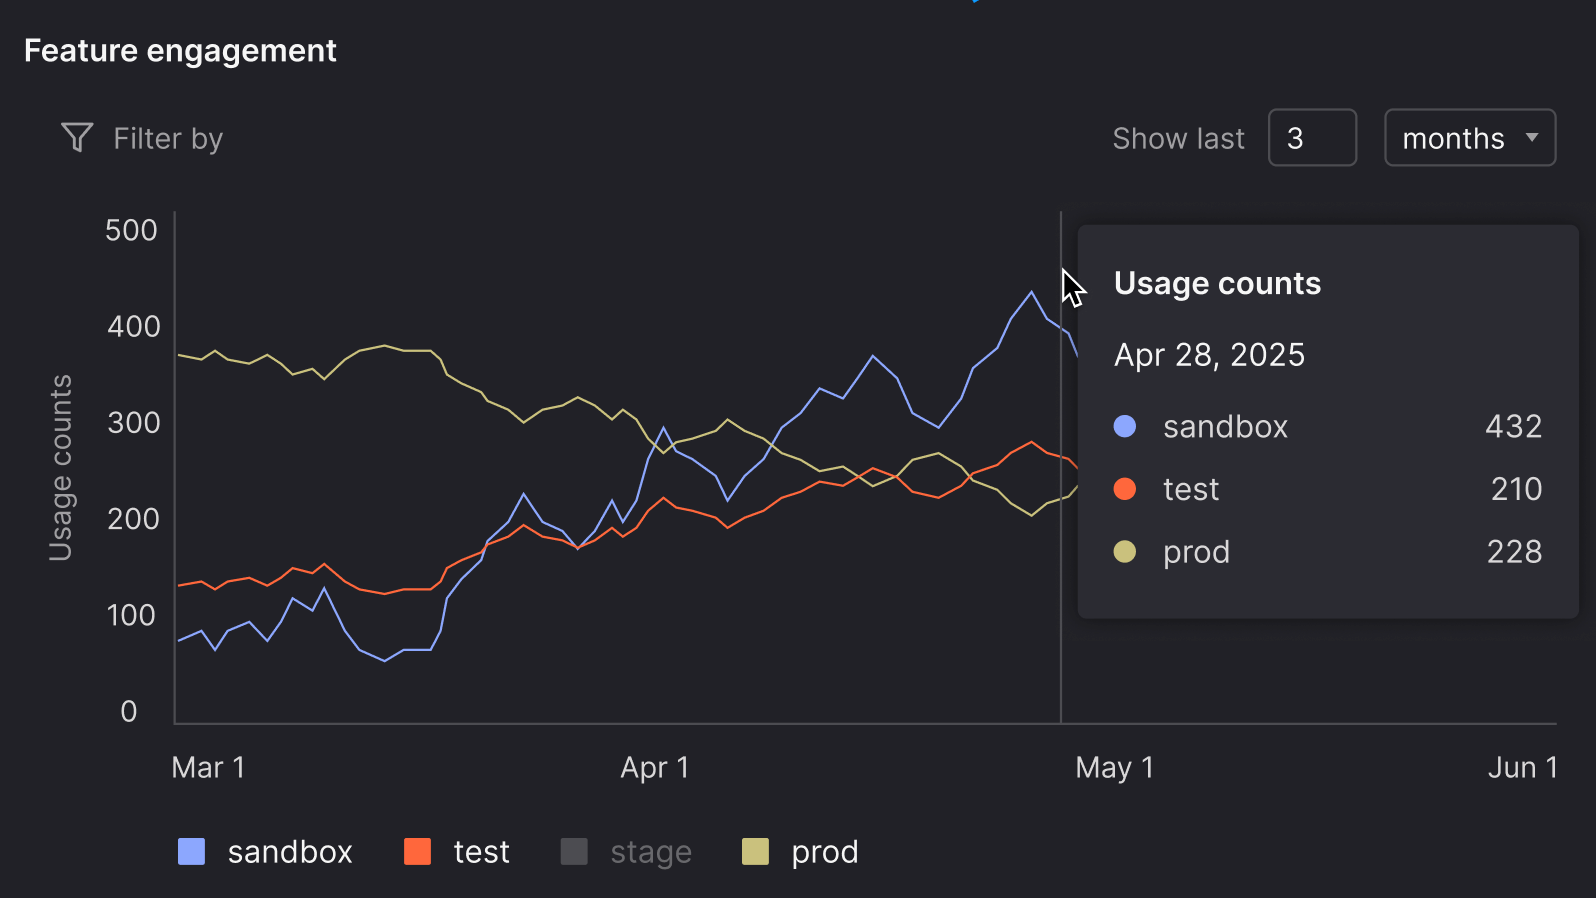
See how often users interact with a feature—right from the story it was built from.
You can now display a usage graph on stories to show how frequently a feature is used over time, across different environments, with filters for customer and location to reveal adoption in different segments.
Use Feature engagement to:
- Confirm that shipped features are being used as intended—or spot where they fall short
- Detect drops in usage after a release or change
- Identify engagement patterns across environments, customers, or locations
- Prioritize high-use features for future investment—and reconsider those with low engagement
Tracking is powered by the Atono SDK and takes just a few lines of code. Once set up, your developers can include a usage call for each feature with its story ID (for example, STORY-123).
Because it’s built into Atono, you can skip external tagging tools or disconnected dashboards—keeping all your data in one workflow and visible to your entire product team, not just those with access to an external tool.