Release, deploy, and monitor
Shipping is just the start. These updates help you see how features are used once they’re live and refine how they’re released—so you can learn faster and improve with every rollout.
Do even more with feature engagement
Last release, we introduced Feature engagement—a way to see whether shipped features are actually being used. From a story, you can display a usage graph that shows adoption trends over time and how they vary across environments, customers, and locations.
This release adds two major enhancements:
Spot your most-used features
The new Engagement page highlights your ten most-used stories. Adjust the timeframe or filter by product theme, team, environment, customer, location, or completed date. The graph updates instantly to show the top features in your selection, helping you see where usage is strongest and how it shifts across segments.
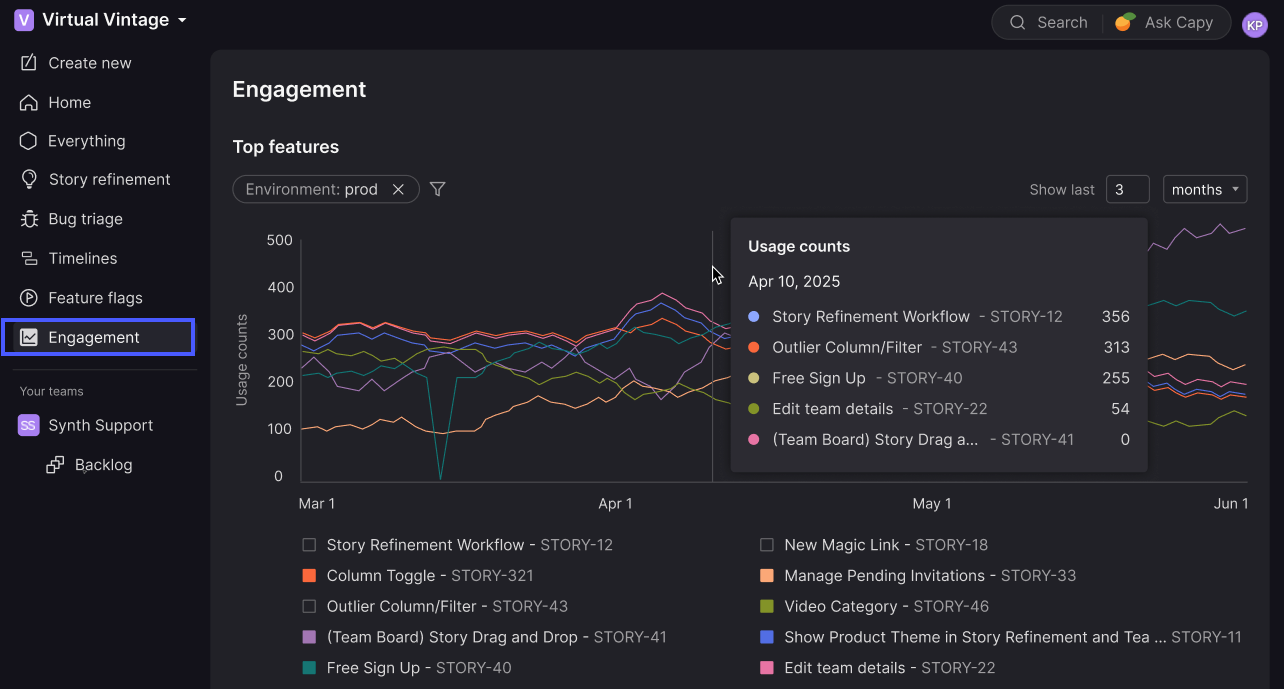
Engagement page highlighting usage trends for your top features.
Map user engagement without code
Once the Atono SDK is set up, there’s no additional developer work required to capture user engagement. With this release, the Atono Chrome extension now enables product managers and other non-technical roles to map a click in your product directly to a story. Every subsequent click is tracked as usage in Atono, tying real interactions back to the work that delivered them.
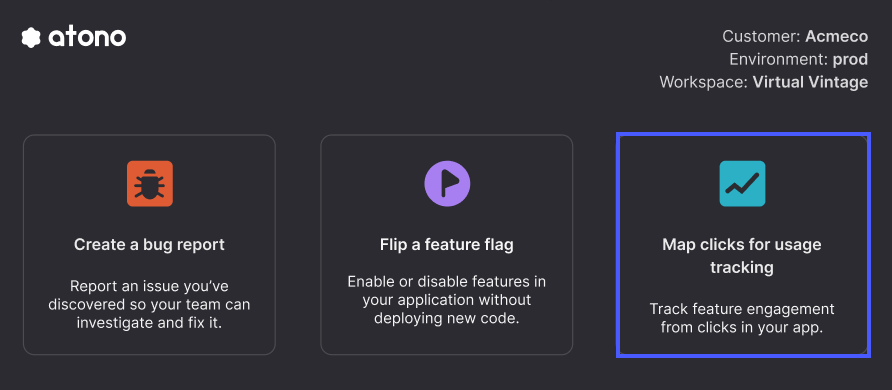
New option to map clicks for usage tracking in the Chrome extension.
Map a click in your app to a story to start tracking usage.
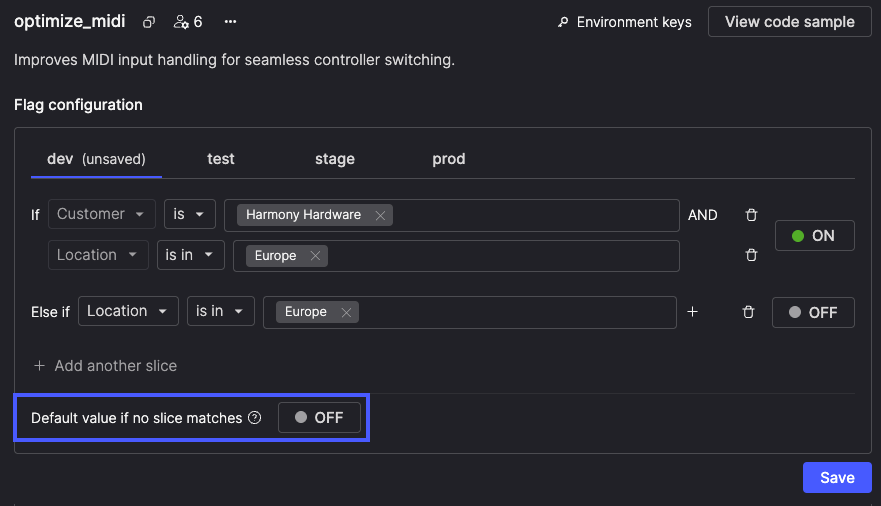
Cleaner slice defaults
When configuring a feature flag, the default condition now appears last in the list of slices. Because slices are checked first and the default only applies if none match, this order makes rollout plans read chronologically so they're easier to understand at a glance.