Feature engagement
Understand how your features are being used—without leaving your workflow.
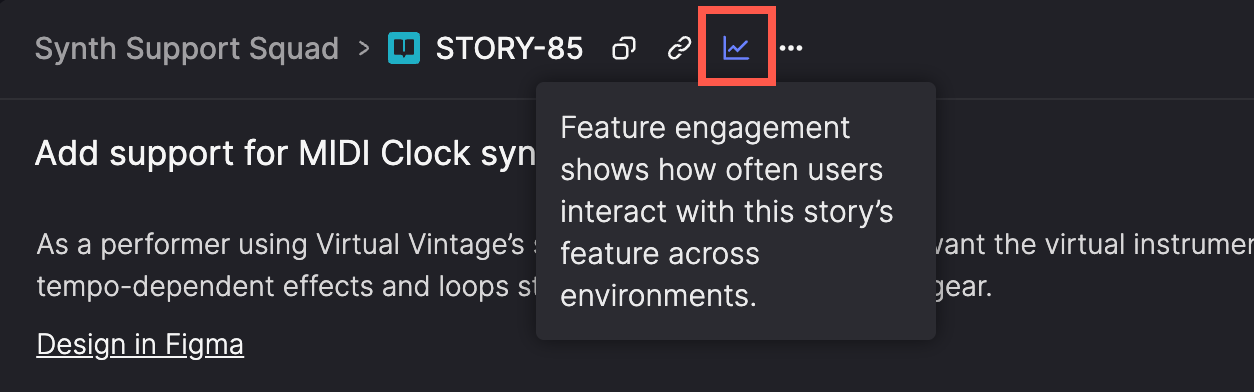
Feature engagement shows how people use a feature—based on real usage events like clicks, taps, or other tracked actions.
Because it’s built directly into your stories, you can see how a feature is performing without switching to a separate analytics tool. This makes it easier to confirm adoption, compare usage over time, and spot when something you shipped isn’t being used as expected.
When usage tracking is set up, Atono adds a usage graph to the story showing:
- How many times the feature has been used
- Which environments, customers, or locations the usage came from
- How usage changes over time
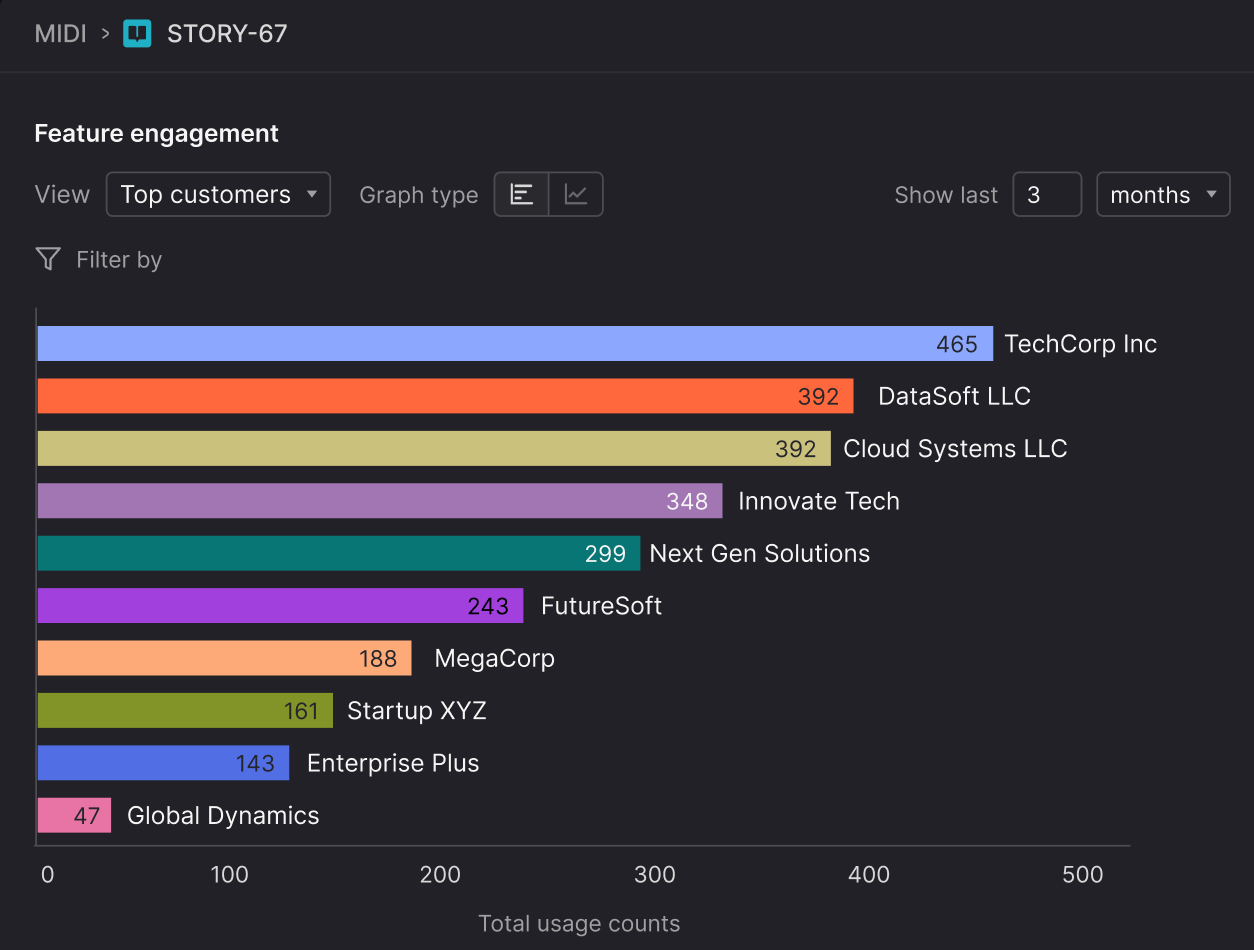
By default, the graph opens in the Top customers view and displays a bar chart, showing up to the 10 customers with the highest recorded usage for that feature. You can use the Graph type control to switch between a bar chart (total usage) and a line graph (usage trends over time).
As you apply filters—by location or environment—the graph updates dynamically to highlight up to 10 customers within that slice of data.
This helps you confirm a feature is getting traction, compare usage before and after changes, and spot when it’s only being used in certain places or by certain customers. And because it’s built into Atono, the graph is visible to your entire product team—not just a select few with access to an external tool.
Atono SDK requiredTo record usage data, your application must send usage events to Atono. This requires installing and initializing the Atono SDK. Once it's set up, usage can be tracked by either adding tracking calls in your code or by mapping clicks to stories with the Atono Chrome extension.
To display data by customer, configure the SDK to include a customer attribute in its usage events. Without it, all usage data will appear as Unknown in the graph.
After tracking is set up, Atono records each interaction automatically—no manual updates required.
Show the usage graph
Click the Feature engagement (graph) icon in the story header.
The graph is available for any story that:
- Is assigned to a team
- Is in a workflow step categorized as 'In progress' or 'Done'
Graph placement
- While a story is in progress, the Feature engagement graph appears below the acceptance criteria and any attachments.
- Once the story is moved to a workflow step categorized as 'Done', the graph moves to the top of the story for easier reference.
Hide feature engagement
You can hide the feature engagement section in a story if you don’t want to see it. This only affects your own view—usage tracking continues and no data is deleted.
- In the Feature engagement section header, click Settings.
- In the Feature engagement dialog, click Hide feature engagement.
Showing or hiding the graph is a personal preference and doesn't affect other users.
Usage data is still collected while tracking is active, even if the graph is hidden.
Interpret the feature engagement graph
The feature engagement graph visualizes how usage of a story's feature evolves over time. Depending on your selected view and graph type, it can display usage by environment or by customer.
Default view
When you first open the graph, it defaults to the Top customers bar chart. This ranks the 10 customers with the highest recorded usage for the selected time period and filters.
If usage data doesn’t include a customer attribute, those events appear as Unknown. This ensures all tracked activity is still represented, even if it isn’t linked to a specific customer. You can hide the Unknown series from the legend if you’d rather focus on attributed data.
If no customer attribute is configured in your SDK, you’ll see No customer attribute beneath the graph. Usage is still recorded and displayed as Unknown until customer tracking is set up.
The Feature engagement graph remembers your selected view, graph type, timeframe, and filters for each story. When you reopen the story, the graph appears in the same state you last used. Settings are saved per user and don’t affect anyone else.
Choose the view
Use the View toggle to change what the graph compares:
- Top customers — usage for up to 10 customers, ranked by usage (default).
- Environments — usage across environments such as sandbox, test, or production.
Toggling off a customer or environment hides that line from the graph but doesn’t replace it with another. At least one line must remain visible.
Choose the graph type
Only available in the Top customers view.
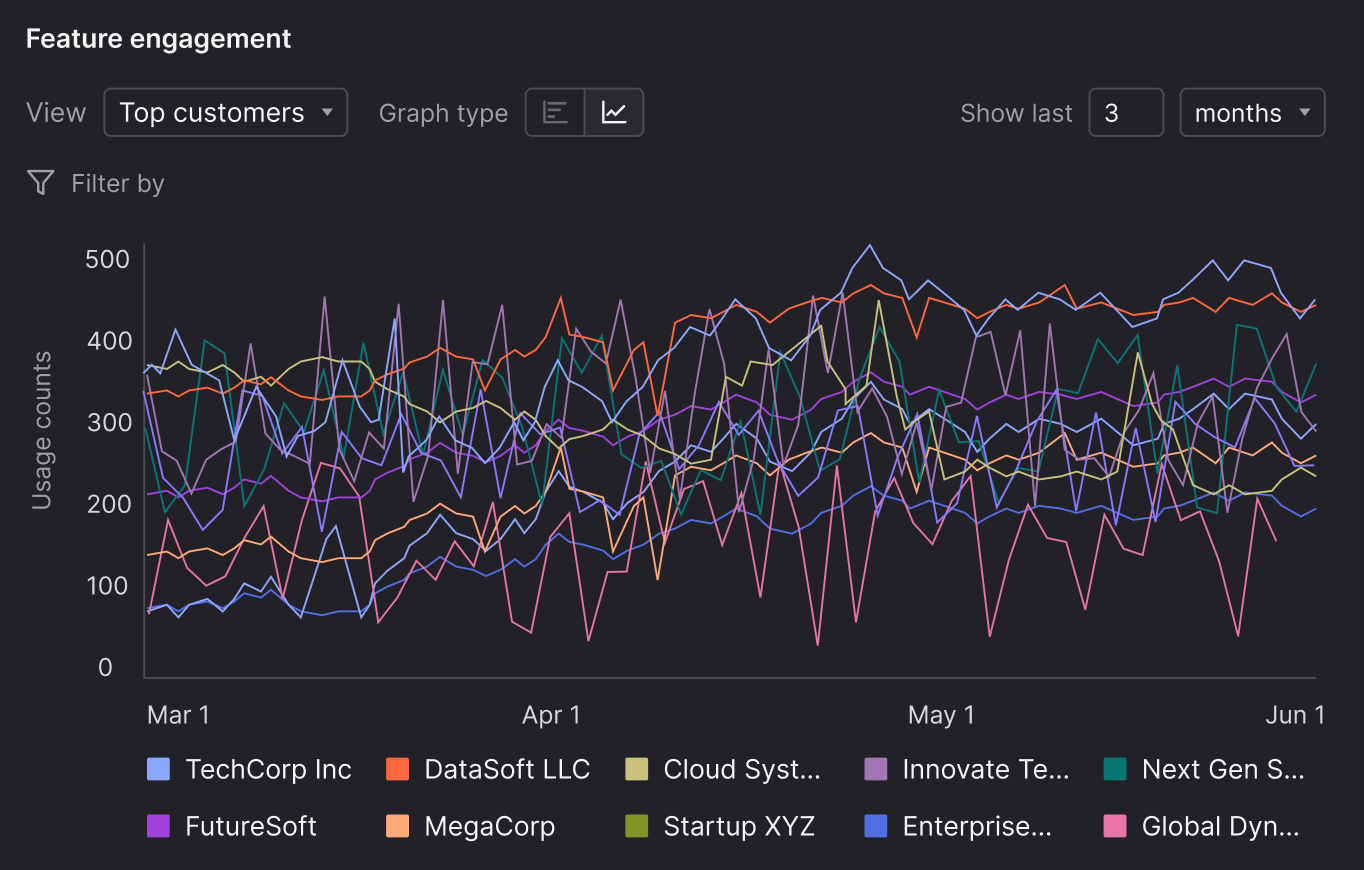
Use the Graph type toggle to switch between a bar chart and a line graph.
The bar chart is the default and shows total usage counts for up to 10 top customers over the selected time period. Switch to the line graph to view usage over time
View usage details
Only available in Environments view.
Hover over the graph to see usage counts for a point in time or date range.
A vertical line will appear to highlight the selected period, along with a breakdown of usage counts by environment, customer, or location (depending on your filters).
Adjust the timeframe
Use the dropdown above the graph to show data for any period between 1 and 60 months. The graph’s resolution adjusts automatically based on the selected range:
- For timeframes under 1 year, the graph shows daily usage counts
- For timeframes over 1 year, the graph shows weekly usage counts
To keep the graph easy to read, Atono limits the total number of data points (up to ~400).
Filter the graph
Available filters depend on which view you're in:
| View | Available filters | Description |
|---|---|---|
| Top customers |
| Focus on how customers user the feature across specific environments and locations. |
| Environments |
| Compare adoption across environments while narrowing to certain customers or regions. |
Filter by environment
Available when in the Top customers view.
Show or hide usage from specific environments by toggling them in the legend below the graph. You can select multiple environments to compare them. The default view shows the last environment listed on the Environments page.
Filter by customer
Available when in the Environments view.
Filter usage by one or more customers. Enter values or pick from suggestions based on reported usage. For more information, see the Customer attribute operators table.
Operators:
- is / is not — exact match to a single customer attribute
- contains / does not contain — partial match to a customer attribute
- is one of / is not one of — match against multiple attributes
Filter by location
Available in both the Top customers and Environments view.
Filter usage by location. Enter or select continent, country, subregion, or state/province names. For more details, see the Location attribute operators table.
Operators:
- is in — include selected locations
- is not in — exclude selected locations
Stop collecting new usage
Stop usage tracking when a story no longer represents an active or relevant feature, or when you want to prevent new data from being recorded going forward.
Common reasons include:
- The feature was removed, replaced, or significantly redesigned.
- Tracking was temporary (for validation or experimentation) and is complete.
- Usage was mapped incorrectly and needs to be fixed.
- You want to freeze historical usage without deleting it.
Stopping usage collection does not delete existing usage data. Historical counts remain visible in the feature engagement graph unless you explicitly clear them.
How you stop usage tracking depends on whether it was configured in code or with the Atono Chrome extension.
Usage tracked in code
A developer must update or remove the relevant record() calls in the application code.
Usage tracked via mapped clicks
Mapped click actions from the Atono Chrome extension can be removed directly from the story.
- Open the story in the Atono web application.
- In the Feature engagement section, click Settings.
- The dialog lists any actions that were mapped through the Atono Chrome extension. Each mapping includes:
- Mapped by - who created the mapping.
- Mapped on - the date and time the mapping was created.
- HTML attribute - the identifier the extension uses to track the element.
- Select the checkbox beside one or more mapped actions.
- Click Delete actions to remove the selected mappings, or Delete actions (all) if everything is selected.
Removing a mapping:
- Stops new usage from being collected for that action.
- Does not delete previously recorded usage.
Clear usage data
Reset the graph when you want a fresh baseline—after a major change, refactor, or to clear out irrelevant data. Clearing usage data removes all past counts for everyone who can view the story. This action is permanent and can't be undone.
If tracking is still active, new usage will appear as soon as users interact with the feature again—whether events are being recorded in your code or captured through mapped clicks in the Atono Chrome extension.
- In the Feature engagement section header, click Settings.
- Select Clear data.
- In the Clear usage data dialog, confirm by clicking Clear usage data, or click X to cancel.
Clearing data does not modify or delete any mapped actions. To stop collecting new usage from extension-based mappings, remove those actions. To stop collecting SDK-based usage, a developer must update the code.
Set up usage tracking
The usage graph only shows data if your application sends usage events to Atono. This requires installing and initializing the Atono SDK.
Once the SDK is in place, you can set up usage tracking in one of two ways:
- Instrument your code – Add
record()calls where features run. This approach is most flexible and is typically handled by a developer. - Use the Atono hrome extension – Map real user interactions (clicks) to stories directly from your browser, without changing code. This is often used by product managers or QA. For details, see Map clicks to stories.
Regardless of which option you choose, each interaction is sent to Atono as a usage event and added to the story’s usage graph. Usage is tracked at the story level, using the story’s unique ID (for example, STORY-67).
Usage tracking requires the SDK to run in your app’s client-side code (the part that runs in the browser). Server-side SDKs aren’t supported for tracking usage events, and the Atono Chrome extension won’t work unless the client-side SDK is installed and initialized.
1. Install the SDK
Version 1.1.0 or later is required.
Run the following command in your project directory:
Client-side applications
npm install --save @atono-io/web-sdkReact applications
npm install --save @atono-io/react-sdk2. Initialize the SDK
Connect the SDK to your Atono environment using your environment key.
You can optionally include customer context if you want to segment usage by that field in the graph. Location is detected automatically from the user's IP address and can represent a continent, country, subregion, or state/province.
Client-side example
import { Atono } from '@atono-io/web-sdk';

const atono = Atono.fromEnvironmentKey('<your-environment-key>');

// Optional: include 'customer' to enable segmentation by this field in the usage graph
await atono.setContext({
  customer: 'Virtual Vintage',
  // location is detected automatically from IP
});
React example
import { AtonoProvider } from '@atono-io/react-sdk';

<AtonoProvider
  environmentKey="<your-environment-key>"
  // Optional: include 'customer' to enable segmentation by this field in the graph
  evaluationContext={{
    customer: 'Virtual Vintage',
    // location is detected automatically from IP
  }}
>
  {children}
</AtonoProvider>
Updating contextYou can update context later (for example, when the active customer changes). Do this before calling
record('STORY-ID')so the event includes the latest values.Set the environment key once per user session—reinitializing the SDK can briefly clear context, which may cause missing data in usage events.
3. Choose how to track usage
Once the SDK is installed and initialized, decide how you want to capture usage events:
Option A - Track usage in code
This is the step that connects the feature to its story in Atono. Call record() when a user interacts with the feature. This logs a usage event tied to the current environment and story.
Once tracking is in place, each time the tagged feature is used, the SDK sends an event to Atono. The event is tagged with the environment (and customer/location if available) and timestamped. The story’s usage graph updates automatically.
Client-side example
const usage = atono.getUsageReporter();

button.addEventListener('click', () => {
  usage.record('STORY-67');
});
React example
import { useUsageReporter } from '@atono-io/react-sdk';

function TryButton() {
  const { record } = useUsageReporter();

  return (
    <button onClick={() => record('STORY-67')}>
      Try the feature
    </button>
  );
}
Option B - Map clicks with the Atono Chrome extension
If you don’t want to add tracking calls in your code, you can use the Atono Chrome extension to capture real user interactions and associate them with stories.
This method still requires the SDK to be installed in your application, but once that’s done, product managers, QA, or other non-developers can set up usage tracking themselves—no code changes needed.
Troubleshooting
Customer not showing in the graph?
Make sure customer is in the SDK context before you call record(). In React, don’t change the environmentKey or re-mount <AtonoProvider> during renders—update context only.
Location not showing or seems wrong?
Location is detected automatically from the user’s IP (continent → country → region/state). If it’s missing or unexpected, check that events come from client-side code (not server-side), and be aware VPNs/proxies can map to a different region.
Context shows up intermittently?
This usually happens if the SDK is reinitialized. Keep the environment key fixed for the session and set the customer context before calling record().
No data at all?
Make sure usage tracking is fully set up before troubleshooting further. Check the following:
- The Atono SDK (v1.1.0 or later) is installed and initialized in your application — the Atono Chrome extension cannot track usage without it.
- A valid story ID is being recorded (for example,
STORY-67) either through record() calls or through mapped clicks in the Atono Chrome extension. - The correct environment key is used.
- The story is assigned to a team and in an In progress or Done workflow step.
- Your selected date range isn’t excluding recent activity.
- Filters aren’t hiding the data you expect to see.