Burndown charts
Track sprint progress and review past performance over time.
Scrum teams use burndown charts to monitor how quickly they’re completing work and whether they’re on track to finish everything planned for a sprint. The chart updates automatically as stories move through the sprint, helping teams spot risks early.
Teams typically use the burndown chart to:
- Monitor progress during an active sprint.
- Identify early signs of delivery risk.
- Discuss scope trade-offs with the team.
- Review how work progressed in completed sprints.
- Support sprint retrospectives.
Understanding time zones in the burndown chartBurndown data is grouped based on the team’s time zone. This ensures each day in the chart reflects the team’s working context, not individual local time zones. All dates, daily progress, and trend lines are calculated using the team time zone.
View the burndown chart
The burndown chart is available for active and completed sprints, allowing you to track current progress or review past performance. You can view it on a dedicated page or within the Sprint details dialog.
Burndown charts are generated only after a sprint starts and are not available for future sprints.
Dedicated burndown page
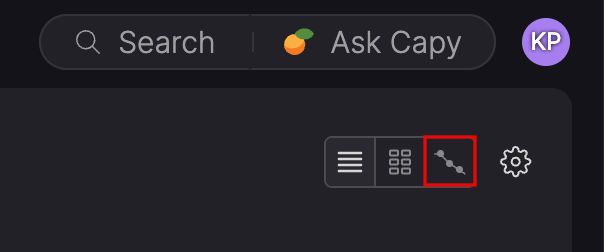
For the active sprint, click the Burndown chart icon in the header of the In progress page (next to the List and Board view icons).
Sprint details dialog
You can also view the burndown chart for active and completed sprints at the bottom of the Sprint details dialog.
From the backlog
- Click the ellipsis (...) icon in the sprint header.
- Click View sprint details.
- Scroll to the Burndown chart section at the bottom of the dialog.
From the Sprint calendar
- Hover over a sprint.
- Click the ellipsis (...) icon next to the sprint and select Edit sprint.
- Scroll to the Burndown chart section at the bottom of the dialog.
What the chart shows
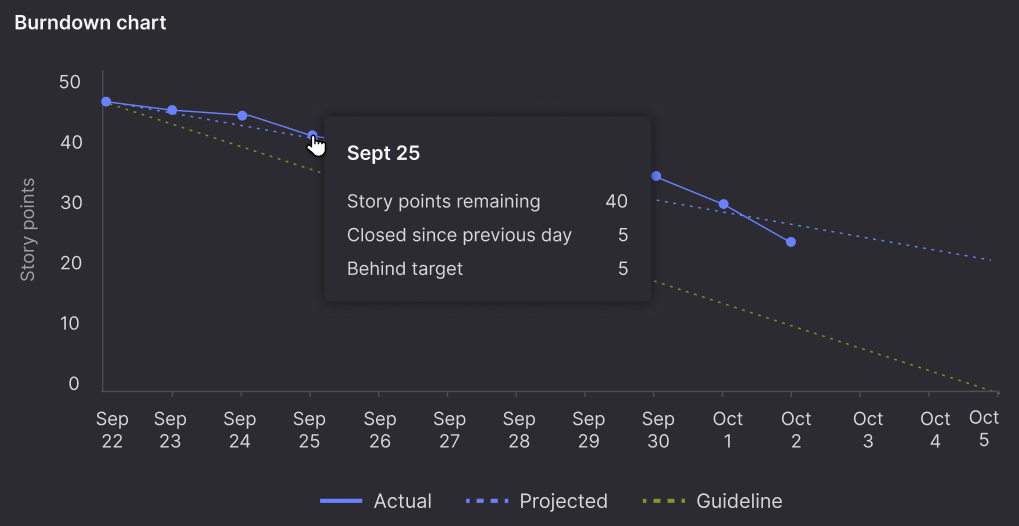
The burndown chart plots how much sprint work remained at each point in time during the sprint:
- Y-axis: Story points remaining in the sprint.
- X-axis: Dates from sprint start to sprint end.
The chart includes:
- Guideline: An ideal, linear path from full scope at sprint start to zero remaining work at sprint end.
- Actual: Daily data points showing the total remaining story points.
- Projected: For active sprints, a trend line estimating how the sprint is progressing based on recent work.
Interpreting the chart
Daily progress
Each point on the Actual line represents the total number of story points remaining at the end of that day. The chart updates automatically as stories are completed or removed from sprint scope (for example, moved to Won’t do).
A steady downward trend indicates consistent progress. Flat or upward movement usually indicates blocked work or scope changes.
Won’t do stories are excluded from sprint totals, burndown calculations, and velocity calculations.
Inspect changes
Hover over a point on the Actual line to see a popup for that day. This works for both active and completed sprints.
The popup always shows:
- The date
- Story points remaining
It may also show:
- Story points closed since the previous day.
- Whether the sprint was ahead or behind target, and by how many story points.
The ahead of target or behind target value shows how the sprint’s actual progress compared to the guideline on that date.
Guideline vs actual
The Guideline represents the ideal pace needed to complete the sprint on time.
The Actual line shows what actually happened.
Comparing the two helps you quickly see whether work is completing faster or slower than planned on any given day.
Projection (active sprints only)
The Projected line appears after three full days of sprint data beyond the sprint start date (the start date does not count toward this total).
The projected line is a best-fit regression line based on the sprint’s progress so far. It shows the overall trend of the sprint if the current pace continues.
For completed sprints, the projected line is not shown. The chart displays only the actual burndown that occurred.
Projection details
Hover over the Projected line to see a summary of the sprint’s projected outcome.
Projection details are available when:
- The active sprint is at least halfway complete (by calendar time), and
- There are at least two completed sprints to calculate an average daily velocity (calculated using calendar days, including weekends).
When enough data is available, the projection also indicates whether the sprint is on track, ahead of schedule, or behind schedule, based on where the projected line reaches zero relative to the sprint end date.
Ahead and behind value are shown in whole days, and rounded down. Differences under one full day are treated as on track.
On track
The sprint is considered on track when the projected line reaches zero on the sprint end date.
The hover summary shows the estimated completion date (the sprint end date) and no scope changes are suggested.
Ahead
The sprint is considered ahead when the projected line reaches zero before the sprint end date.
The hover summary shows:
- Estimated completion date, including how many days early.
- Stories that could be completed this sprint if additional scope is added.
Stories are suggested in priority order, based on what could fit into the remaining time in the sprint.
The chart considers, in order:
- Items are selected in the order they appear in the next sprint’s To do list.
- Items from later sprints, if needed.
- Unscheduled items, if no future sprint items apply.
If the next story in order won't fit, the chart looks for a smaller story that will.
Behind
The sprint is considered behind when the projected line reaches zero after the sprint end date.
The hover summary shows stories unlikely to be completed by the sprint end date.
Stories are evaluated based on their likelihood of completion:
- Items further along in the workflow are more likely to complete than items earlier in the workflow.
- Partially completed stories do not count as completed.
Effect of scope changes on the burndown
Changing the sprint scope recalculates the burndown chart to reflect the new total. If you have permission to modify sprint scope, you’ll see a warning before making scope changes to active or completed sprints.
Scope changes include:
- Adding stories to the sprint.
- Removing stories from the sprint.
- Moving stories to 'Won't do'.
- Moving stories between 'To do/In progress' and 'Done'.
Active sprints
Adding stories mid-sprint increases the total work, while removing stories or moving them to 'Won’t do' reduces it. Because scope changes alter the shape of the burndown, they can make it harder to evaluate whether the team is maintaining consistent velocity.
Completed sprints
Changing the scope of a completed sprint updates its burndown and affects historical velocity calculations used for future sprint planning. Retroactive scope changes can skew planning data, so proceed carefully.
The burndown chart is recalculated automatically if the sprint’s start date, end date, or contents change.
Notes and assumptions
Unsized stories
Stories without a size estimate are still included in the burndown chart using inferred values:
- Unsized stories count as the nearest Fibonacci number to the team’s average sized story, based on the team’s configured historical averaging window.
- If a sprint contains no sized stories, each unsized story counts as one story point.
This ensures all sprint work is reflected in the burndown, even if sizing isn’t complete.