

Story throughput
Understand how much work your team completes over time and how its delivery rate is changing.
Story throughput shows completed work over a selected timeframe. You can view throughput as a count of stories or as story points to account for the relative size of the work delivered.
Time periods are based on the team's time zone.
Access Story throughput
To open the Story throughput report:
- In the side menu, click the team.
- Click the View team overview icon next to the team name.
- Select the Analytics tab.
- From the report selector, select Story throughput.
View stories or story points
Choose whether to measure throughput by the number of stories completed or by the story points delivered:
- Story shows the number of stories completed in each period.
- Story points shows the number of story points completed in each period.
Hover over a bar to see a pop-up with more detail. In Story view, story points are shown when available. In Story points view, the number of stories is also shown.
To switch views, select Story or Story points above the chart.
Switching between them updates the chart, summary, trend, and pop-up information. Atono remembers your selection when you return to the report.
Change the timeframe
Choose how much historical data to include and how to group the results.
- Next to Show last, enter a number and select weeks or months.
- From View, select:
- Weekly to make each bar represent a week.
- Monthly to make each bar represent a month.
- Sprints to make each bar represent a sprint, if the team uses Scrum.
When you select Sprints, only complete sprints are shown and the timeframe adjusts to align with sprint boundaries.
Atono remembers your timeframe and view settings when you return to the report.
Understand the report
The Story throughput report includes summary values for the selected timeframe and a chart showing how throughput changes from one period to the next.
Summary
The summary cards above the chart show:
- Total stories or Total story points — the total completed in the selected timeframe.
- Weekly average, Monthly average, or Sprint average — the average completed per finished period.
The current period isn't included in the average until it is complete.
Chart
Each bar represents a period based on the selected View: a week, month, or sprint. Periods with no completed stories are still shown.
If the selected timeframe begins partway through a period, the first bar is identified as a partial period.
How completed stories are countedA story counts toward a period when it reaches a final Done state and remains there through the end of that period. If it's reopened during the same period, it isn't counted. If it's closed again in a later period, it counts toward the later period.
Hover for details
Hover over a bar to see a pop-up with:
- The date range.
- The total number of stories and story points, when available.
- A breakdown by story size.
The selected view determines which metric is emphasized. In Story view, the story count is shown first. In Story points view, story points are shown first.
When viewing by sprint, the pop-up also shows the sprint name.
Trend
The trend line shows the overall direction of your team's throughput across the selected timeframe, helping you see whether delivery is generally increasing, decreasing, or staying relatively steady.
The trend reflects the view you've selected — stories or story points — and is calculated using completed periods only. The current period isn't included because it's still in progress.
Use the trend as an indication of the overall delivery pattern rather than the expected result for any individual period. Individual weeks, months, or sprints may vary above or below the trend.
Projections
The final bar in the Story throughput chart represents the current period. Because the period is still in progress, Atono shows both the amount completed so far and a projection of the total expected by the end of the period.
The projected total is based on the average number of stories or story points completed per period within the team's cycle time window.
Story and story point projections are calculated separately based on the team's historical averages for each metric. They don't represent projections for specific in-progress stories or their sizes.
Hover over the current period to see:
- The amount completed so far.
- The projected total for the period.
- The date range covered by the projection.
For example, in the current period shown below, 1 story worth 13 story points has been completed. Based on the team's historical averages, Atono projects a total of 3 stories or 19 story points by the end of the period.
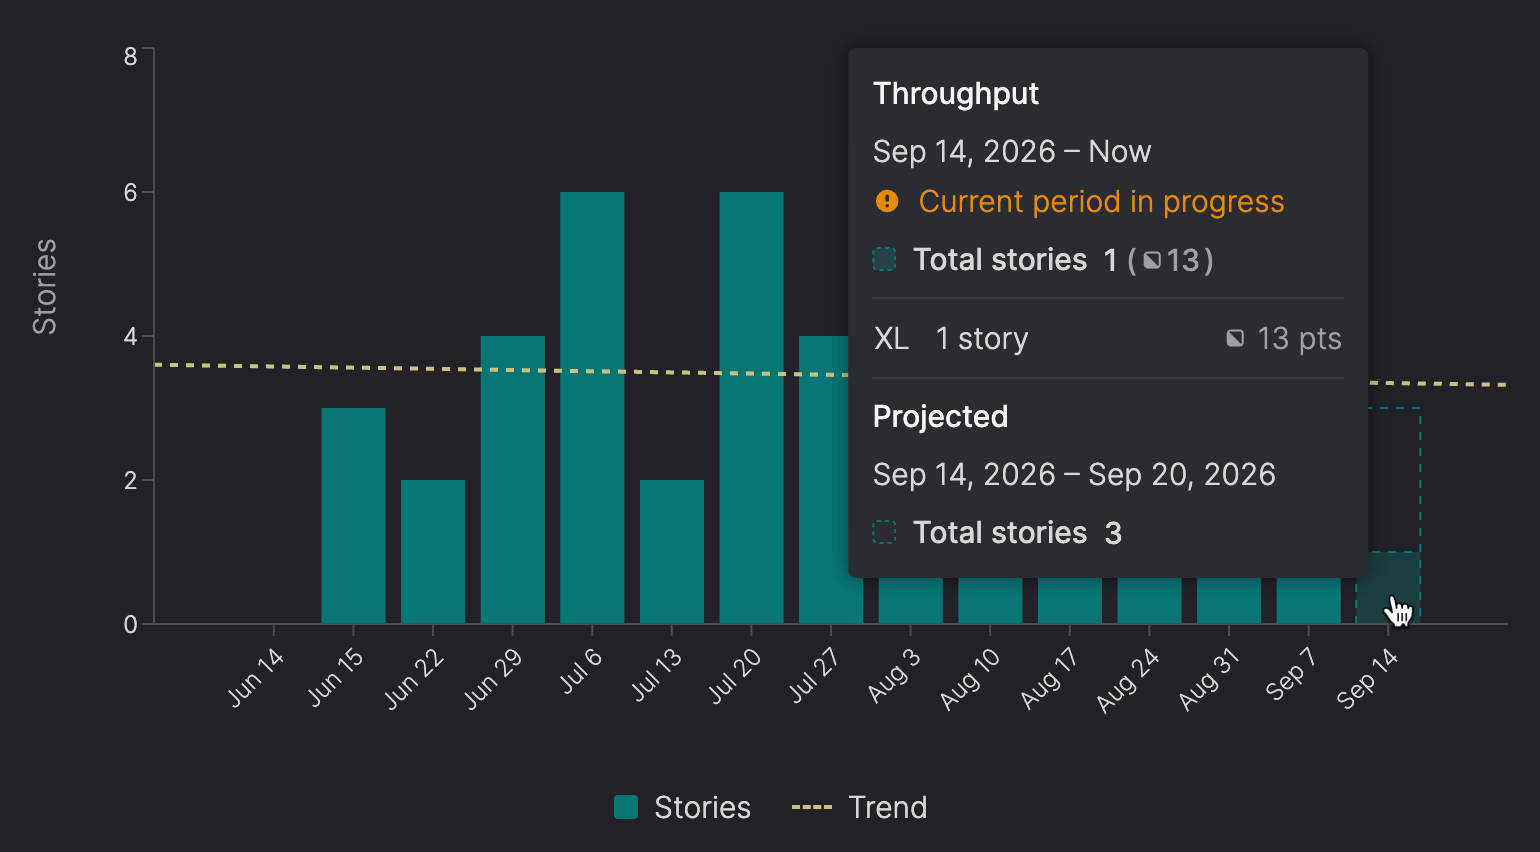
Story mode: 1 story completed so far, with 3 stories projected for the full period.
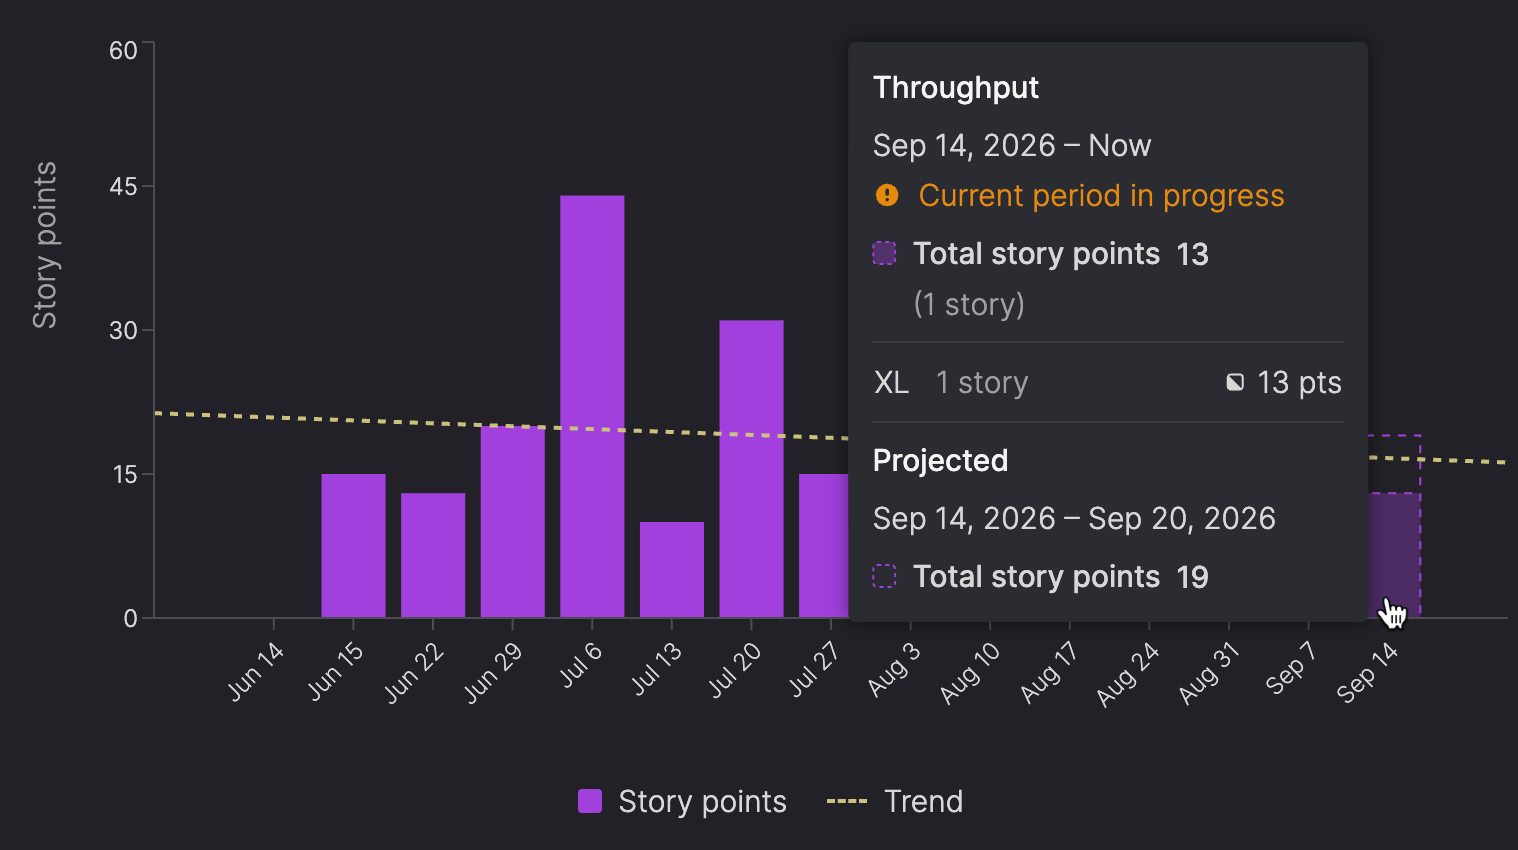
Story points mode: 13 story points completed so far, with 19 story points projected for the full period.
Missing story point estimates
If some completed stories don't have story points, Atono can still calculate Story point throughput by approximating the missing values.
When some stories have points and others don't, Atono uses the team's median story size to approximate point values for the stories without an estimate. These approximated values are included in the totals.
The report identifies when approximated values are being used:
- A warning appears on affected summary values.
- Affected bars are marked in the chart.
- In the pop-up, approximated point values are prefixed with a tilde (
~). - A note below the chart explains that missing story points were approximated.
If none of the completed stories in the selected timeframe have story points, Atono can't calculate Story point throughput. You can switch to Story to view throughput by story count instead.
View completed stories
Open the stories behind a period to investigate the work contributing to its throughput.
- Select a bar in the chart.
- Atono opens Everything with filters applied for:
- The current team.
- Item type Story.
- Workflow steps in the Done category.
- The selected period's completed date range.
If the team is private and you aren't a member, you can't open the underlying stories.
Updated 28 minutes ago